

 Exports of California-made products edged up slightly in December, according to Beacon Economics’ analysis of the latest U.S. trade statistics released by the U.S. Census Bureau last week.
“On net, the United States has experienced remarkably little difficulty adjusting to the trade conflict with China and to a weaker global economy,” said Christopher Thornberg, founding partner of Beacon Economics. “This isn’t too surprising given the strong brands and large buyers that operate in the U.S. and give us an edge during trying times.”
Trade Overview
According to Beacon Economics’ California Trade Report, California businesses shipped a total of $14.03 billion in merchandise abroad in December, a nominal 0.4% increase over the $13.98 billion in exports recorded in December 2018. Shipments of manufactured goods rose 2.8% to $9.11 billion from $8.86 billion one year earlier.
However, exports of Non-Manufactured Goods (chiefly the state’s agricultural products and raw materials) declined 6.7% from $1.95 billion. The state’s export numbers were also pulled down by a 1.9% dip in re-exports, which fell to $3.10 billion from $3.16 billion.
For all of 2019, the state’s exports totaled $173.33 billion, down 2.8% from the $178.40 billion recorded in 2018. Manufactured exports slipped by 0.4% from 2018, while shipments abroad of Non-Manufactured Goods, valued at $112.11 billion, were off by 1.0%. Re-exports tumbled 10.0% to $38.97 billion, the report states.
Imports Fall
California imported goods declined by 10.0% in December—from $36.86 billion in December 2018 to $33.18 billion in December 2019, according to the U.S. Census Bureau.
For 2019 as a whole, California’s import trade totaled $408.13 billion, down 7.5% from the previous year. Imports of manufactured goods declined by 7.6% to $361.27 billion, while imports of nonmanufactured goods amounted to $46.86 billion, down 6.4% from 2018.
Trading Partners
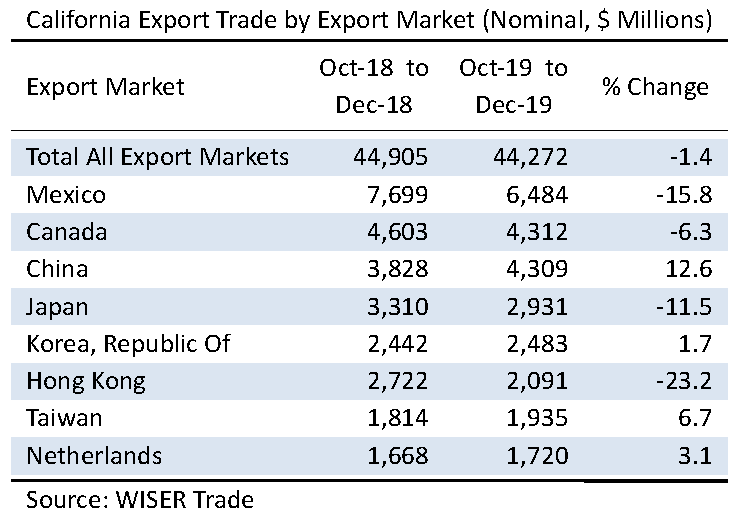
Mexico maintained its status as California’s leading export destination despite a 15.8% drop in imports to $6.48 billion in the last quarter of 2019 from $7.70 billion in the last quarter of 2018, the Trade Report shows. Canada narrowly maintained its position at No. 2, followed by China at No. 3. Canada’s imports from California fell 6.3% to $4.31 billion from $4.60 billion, while the state’s exports to China grew by 12.6% to $4.31 billion from $3.83 billion. Japan came in fourth with imports of California goods totaling $2.93 billion, down 11.5% from $3.31 billion last year. Rounding out the state’s Top Five export destinations was South Korea with $2.48 billion in imports from California, up 1.7% from $2.44 billion one year earlier.
California’s exports to Hong Kong fell by 23.2% to $2.09 billion from $2.44 billion. Meanwhile, Belgium slipped by the United Kingdom to join the roster of California’s Top 10 export destinations in the last quarter of 2019, with imports of California products totaling $1.47 billion, up 106.8% over the same period one year earlier.
Mexico and Canada together accounted for $10.80 billion in California exports in the last quarter of 2019, or 24.4% of California’s total merchandise export trade, down 27.4% from one year earlier, according to the Trade Report. Exports to the two neighboring countries in the last quarter of 2019 fell by 12.2% compared to the final quarter of 2018.
Commodities
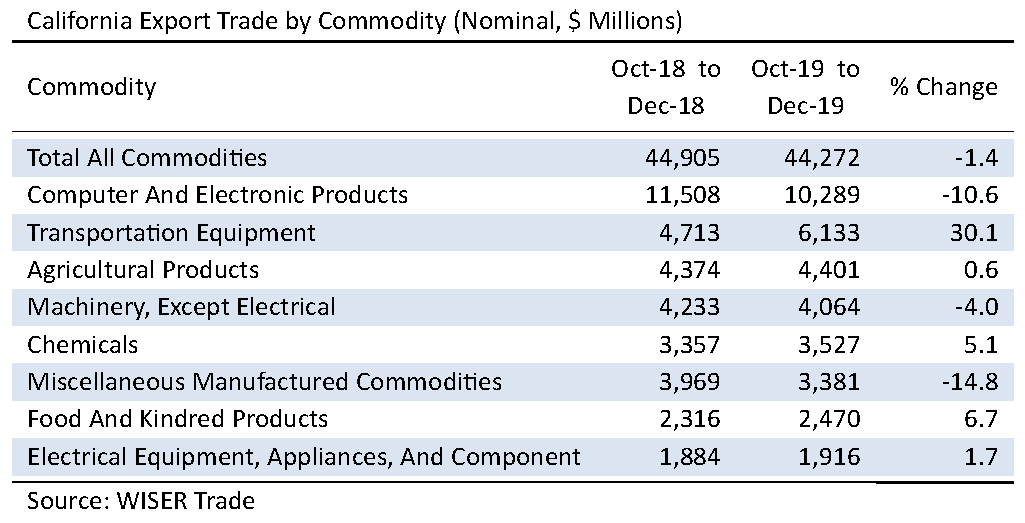
California exports of Transportation Equipment soared by 30.1% to $6.13 billion from $4.71 billion, and shipments of Agricultural Products edged up by 0.6% over the previous December, moving up to $4.40 billion from $4.37 billion. Chemical exports were up 5.1% to $3.53 billion from $3.36 billion. Also up were exports of food and Kindred Products, which increased by 6.7% to $2.47 billion from $2.32 billion. Exports of Electrical Equipment and Appliances rose 1.7% to $1.92 billion from $1.88 billion.
On the downside, exports of Computer and Electronic Products slid by 10.6% to $10.29 billion from $11.51 billion as the U.S.-China trade dispute continues to roil electronics supply chains, the Report states.
Shipments of Non-Electrical Machinery slumped by 4.0% to $4.06 billion from $4.23 billion. Exports of Miscellaneous Manufactured Commodities (a catchall category of merchandise ranging from medical equipment to sporting goods) tumbled by 14.8% to $3.38 billion from $3.97 billion.
Exports of Fabricated Metal Products edged lower by 3.2% to $1.56 billion from $1.20 billion. Waste & Scrap exports slumped by 13.0% to $1.02 billion from $1.17 billion one year earlier as scrap paper products continue to face ever stiffer environmental restrictions abroad. Falling from the billion-dollar export category was Petroleum and Coal Products, which sagged by 9.5% to $967 million from $1.07 billion one year earlier.
More Information
To read the full California Trade Report, visit https://beaconecon.com/publications/california-trade-report/.
