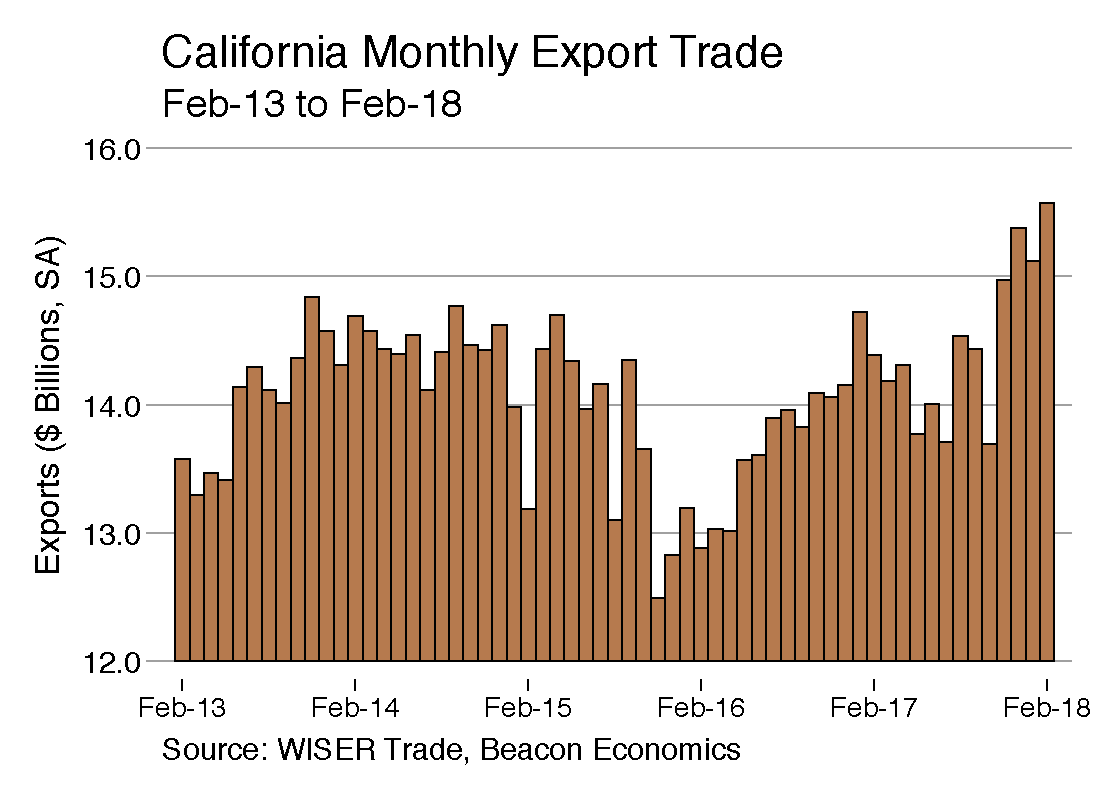
California’s merchandise export trade rose in February, according to a Beacon Economics analysis of U.S. trade statistics recently released by the U.S. Census Bureau.
Foreign shipments by California businesses totaled $14.62 billion for the month, a nominal 8.6% gain over the $13.46 billion recorded a year earlier.
The state’s exports of manufactured goods in February rose by 4.4% to $9.3 billion from $8.91 billion one year earlier. Exports of nonmanufactured goods, however (chiefly agricultural products and raw materials), surged 28% to $2.01 billion from $1.57 billion. Re-exports, meanwhile, increased by 10.7% to $3.3 billion from $2.98 billion.
California accounted for 11.4% of the nation’s overall merchandise export trade in February.
California Imports Increase
The U.S. Census Bureau reports that California was the state of destination for 17.7% of all U.S. merchandise imports in February, with a value of $33.25 billion, 12% higher than the $29.68 billion in imported goods in February 2017. Manufactured imports totaled $29.67 billion, up 12.6% from $26.34 billion. Nonmanufactured imports were valued at $3.58 billion, 6.9% higher than the $3.35 billion recorded one year earlier.

Closer Look
As always, Beacon Economics cautions against reading too much into month-to-month fluctuations in state export statistics, especially when focusing on specific commodities or destinations. Significant variations can occur as the result of unusual developments or exceptional one-off trades and may not be indicative of underlying trends. For that reason, Beacon Economics compares the latest three months for which data are available (that is, December 2017–February 2018) with the corresponding period one year earlier.
Leading Export Commodities
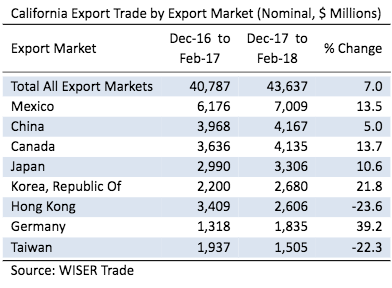
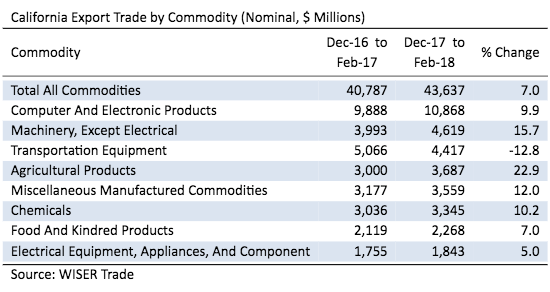
California’s merchandise exports during the last quarter of the year totaled $43.64 billion, a nominal gain of 7% from the $40.79 billion in the same period in the previous year. Of the 10 categories of California exports that normally see shipments valued at more than $1 billion in the latest three-month period), eight reported increases.
On the plus side, shipments of Computer & Electronic Products (computers and peripherals; communication, audio, and video equipment; navigational controls; and electro-medical instruments) moved up by 9.9% to $10.87 billion from $9.89 billion. Exports of Non-Electrical Machinery (machinery for industrial, agricultural and construction uses as well as ventilation, heating, and air conditioning equipment) improved by 15.7% to $4.62 billion from $3.99 billion.
Shipments of Miscellaneous Manufactured Commodities (a catchall category of merchandise ranging from medical equipment to sporting goods) edged higher by 12% to $3.56 billion from $3.18 billion. Chemical exports (including pesticides and fertilizers; pharmaceutical products; paints and adhesives; soap and cleaning products; and raw plastics, resins, and rubber) gained 10.2% to $3.44 billion from $3.04 billion.

Agricultural exports jumped by 22.9% to $3.69 billion from $3.0 billion. Shipments abroad of Food & Kindred goods grew 7% to $2.27 billion from $2.12 billion. Exports of Electrical Equipment and Appliances increased 5% to $1.84 billion from $1.75 billion. Exports of Petroleum and Coal Products leaped 23.6% to $1.37 billion from $1.11 billion. Waste & Scrap exports roared ahead by 39.2% to $1.30 billion from $935 million. Exports of Fabricated Metal Products were up by 6.1% to $1.02 billion from $957 million.
On the minus side, the state’s exports of Transportation Equipment (automobiles, trucks, trains, boats, airplanes, and their parts) were off by 12.8% to $4.42 billion from $5.07 billion. Sharp declines in exports of Aerospace Products to Taiwan and France helped send California’s Transportation Equipment shipments lower. Exports of Primary Metal Manufacturing products fared worse, tumbling 42.9% to $973 million from $1.71 billion.
Destinations
Mexico maintained its position atop the list of California’s most important export destinations during the latest three-month period. Shipments south of the border grew by 13.5% to $7.01 billion from $6.18 billion. China edged ahead of Canada as the state’s second largest export market, with shipments increasing 5% to $4.17 billion from $3.97. Canada slipped to third place even though California’s exports north of the border grew by 13.7% to $4.13 billion from $3.64 billion. In fourth place was Japan, which imported $3.31 billion worth of California goods, an increase of 10.5% from $2.99 billion during the same period a year earlier. South Korea moved ahead of Hong Kong to round out the roster of California’s top five foreign markets. Exports to South Korea rose 21.8% to $2.68 billion from $2.2 billion. (Hong Kong saw its California imports plummet by 23.6% to $2.61 billion from $3.41 billion one year ago.)
The state’s export trade with the economies of East Asia edged lower by 0.3% to $16.05 billion from $16.10 billion. China accounted for 26% of California’s exports to Asia, followed by Japan with a 20.6% share. By sharp contrast, California’s exports to the European Union rose by 10% to $7.99 billion from $7.26 billion. That increase was powered largely by a 39.2% surge in California exports to Germany.
Continuing to emphasize the economic importance of the North American Free Trade Agreement, Mexico and Canada together accounted for 25.5% of California’s merchandise export trade in the latest three-month period, up from 24.1% in the same period one year ago.
Mode of Transport
The latest three-month period saw 48.3% of the state’s $43.64 billion merchandise export trade depart by air, while waterborne transport carried 29.8% of the outbound trade. The balance of the state’s exports moved overland.

The Outlook
Since Beacon’s last report a month ago, the trade policy pot has been stirred and then re-stirred. First came U.S. tariffs on imported steel and aluminum that were initially imposed universally but then were quickly revised to exclude most friendly steel and aluminum exporters. China was not among those favored by this revision and, almost predictably, came Beijing’s response in the form of China’s own tariffs (really surcharges on existing import duties) levied against a range of U.S. products including fruits, nuts, wines, pork and, not to be ignored, aluminum waste and scrap.
Washington then upped the ante by publishing an extensive list of Chinese products that would be hit with 25% tariffs, to which Beijing countered with its own list of new 25% tariffs it might impose on U.S. exports ranging from soybeans to aerospace products. These tariff threats will now be the subject of negotiations over the next few months.
For the time being, a new 15% tariff on U.S. exports of fruits, nuts, and wines took effect on April 2, which is not good news for those California growers and winemakers directly affected by the extra import charge. More broadly, California’s agricultural exports to China last year totaled $732 million, only about 5.4% of the worldwide total of $13.68 billion, so the new tariffs are not calamitous for the state’s agricultural sector. Moreover, if Chinese food and wine importers who have worked hard to develop a presence for California-grown products in China believe the tariff is a bargaining chip that will soon be removed, they might decide to absorb the cost rather than disrupt the markets they have built.
For now, Beacon experts expect a surge in the March export numbers as exporters deliver shipments of California goods to China before Chinese customs collectors ratchet up levies. In the bigger picture, continued strength in the U.S. economy should buoy imports while weakness in the dollar and growth among our trading partners will continue to fuel exports.
Staff Contact: Susanne T. Stirling

