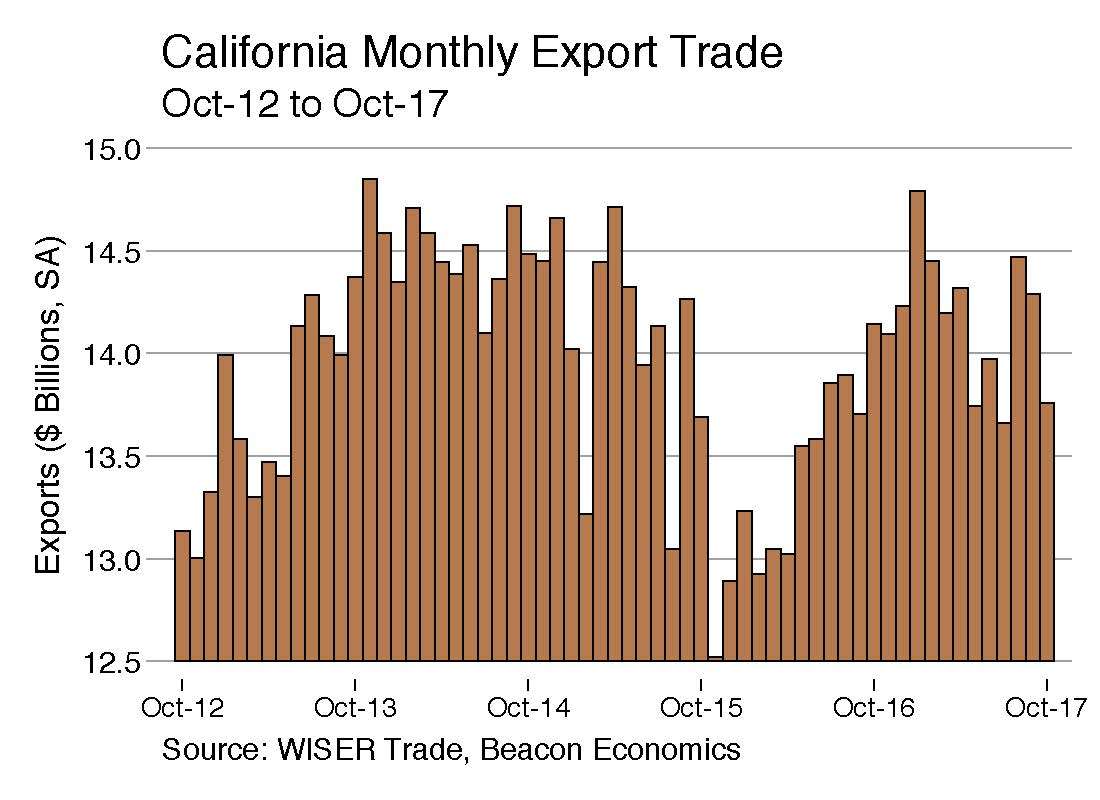
California’s export trade dipped in October, according to a Beacon Economics analysis of U.S. trade statistics released December 5 by the U.S. Census Bureau.
 Foreign shipments by California businesses totaled $14.82 billion for the month, a nominal 2.6% decline from the $15.21 billion recorded in October 2016.
The state’s exports of manufactured goods fell 4.6% to $8.87 billion from $9.3 billion one year earlier. Exports of nonmanufactured goods (chiefly agricultural products and raw materials) ebbed slightly by 0.4% to $2.31 billion from $2.32 billion. Re-exports, meanwhile, rose by 1.7% to $3.65 billion from $3.59 billion.
California accounted for 10.9% of the nation’s overall merchandise export trade in October. Through the first nine months of 2017, the state’s exports are running 4.5% ahead of last year.
California Imports Rise
The U.S. Department of Commerce has determined that California was the state-of-destination for 18.6% of all U.S. merchandise imports in October, with a value of $39.72 billion, 5.2% higher than the $37.76 billion in imported goods in October 2016. Manufactured imports totaled $35.97 billion, up 3.2% from $34.87 billion last year. Non-manufactured imports in October were valued at $3.75 billion, fully 29.8% higher than the $2.87 billion recorded one year earlier.
A Closer Look at The Numbers
As always, Beacon Economics cautions against reading too much into month-to-month fluctuations in state export statistics, especially when focusing on specific commodities or destinations. Significant variations can occur as the result of unusual developments or exceptional one-off trades and may not be indicative of underlying trends. For that reason, Beacon Economics compares the latest three months for which data are available (i.e., August–October) with the corresponding period one year earlier.

Leading Export Commodities
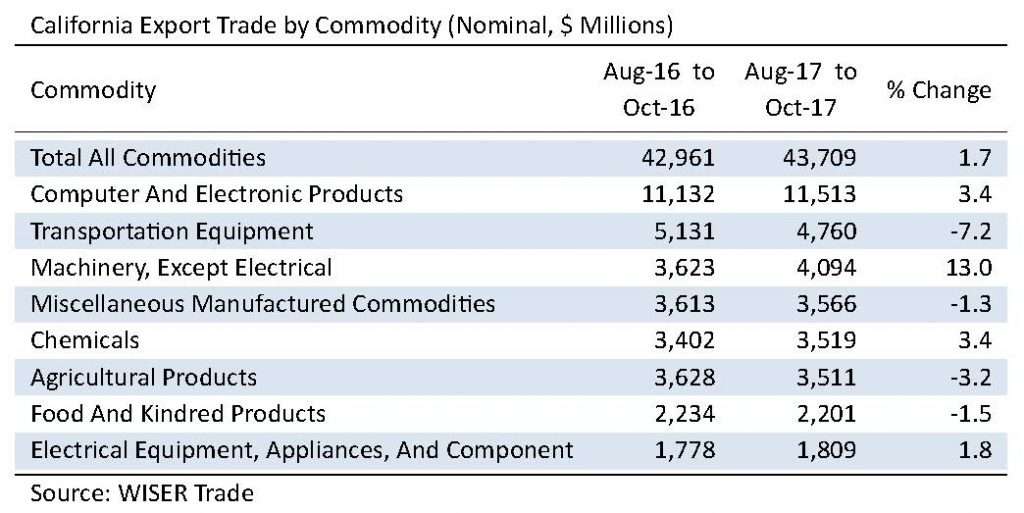
California’s merchandise exports during the year’s third quarter totaled $43.71 billion, a nominal gain of 1.7% from the $42.96 billion in the same period last year. Of the state’s 10 leading categories of exports, six saw increases.
On the plus side, shipments of Computer & Electronic Products (computers and peripherals; communication, audio, and video equipment; navigational controls; and electro-medical instruments) rose 3.4% to $11.51 billion from $11.13 billion. Exports of Non-Electrical Machinery (machinery for industrial, agricultural and construction uses as well as ventilation, heating, and air conditioning equipment) improved by 7.2% to $4.09 billion from $3.62 billion.
Chemical exports (including pesticides and fertilizers; pharmaceutical products; paints and adhesives; soap and cleaning products; and raw plastics, resins, and rubber) gained 3.4% to $3.52 billion from $3.4 billion. Exports of Electrical Equipment and Appliances grew by 1.8% to $1.81 billion from $1.78 billion. Exports of Fabricated Metal Products rose 1.9% to $1.09 billion from $1.07 billion. Waste & Scrap exports jumped by 26.1% to $1.07 billion from $892 million.
On the downside, the state’s exports of Transportation Equipment (automobiles, trucks, trains, boats, airplanes, and their parts) slipped from 7.2% to $4.76 billion from $5.13 billion. Shipments of Miscellaneous Manufactured Commodities (a catchall category of merchandise ranging from medical equipment to sporting goods) fell by 1.3% to $3.57 billion from $3.61 billion.
Agricultural exports edged lower by 3.2% to $3.51 billion from $3.63 billion, while shipments abroad of Food & Kindred goods also declined, dropping by 1.5% to $2.2 billion from $2.23 billion. Exports of Primary Metal Manufacturing products dropped by 41.2% to $850 million from $1.45 billion.

Destinations
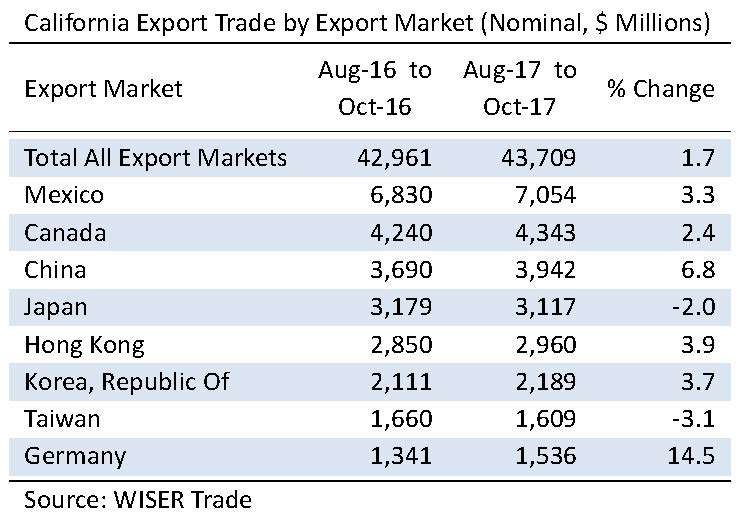
Mexico easily retained its position atop the list of California’s most important export destinations during the latest three-month period. Shipments south of the border grew by 3.3% to $7.05 billion from $6.83 billion. Canada was the state’s second largest export market, growing 2.4% to $4.34 billion from $4.24 billion. Exports to China rose 6.8% to $3.94 billion from $3.69 billion. In fourth place was Japan, even though its purchases of California goods slipped by 2.0% to $3.12 billion from $3.18 billion. Hong Kong (up 3.9% to $2.96 billion from $2.85 billion) rounded out California’s Top Five export destinations during the latest three-month period.
The state’s export trade with the economies of East Asia slipped by 1.8% to $15.71 billion from $16 billion. By contrast, California’s exports to the European Union rose by 12% to $8.17 billion from $7.3 billion. Mexico and Canada, America’s partners in the North American Free Trade Area, accounted for 26.1% of California’s merchandise export trade in the latest three-month period, up from 25.8% one year ago.
Mode of Transport
During the most recent three months, 48.3% of the state’s $43.71 billion merchandise export trade went by air, while waterborne transport carried 28.6% of the outbound trade. The balance of exports traveled overland to Canada and Mexico.
The Outlook
In Beacon Economics’ estimation, the near-term outlook for California exporters remains generally positive, if only because global economic fundamentals look encouraging. It is on the policy front that trading conditions may deteriorate suddenly.
The new year will present a series of challenges to international trade. Beacon Economic experts’ foremost concern lies with the future of the North American Free Trade Agreement (NAFTA). As noted in the Beacon analysis of the latest California export statistics, Mexico and Canada account for more than one-fourth of the state’s export trade. U.S. trade relations with important partners in Asia and Europe will also be tested in 2018 as President Donald Trump continues his efforts to redress what he perceives as unfair practices.
Staff Contact: Susanne T. Strirling


