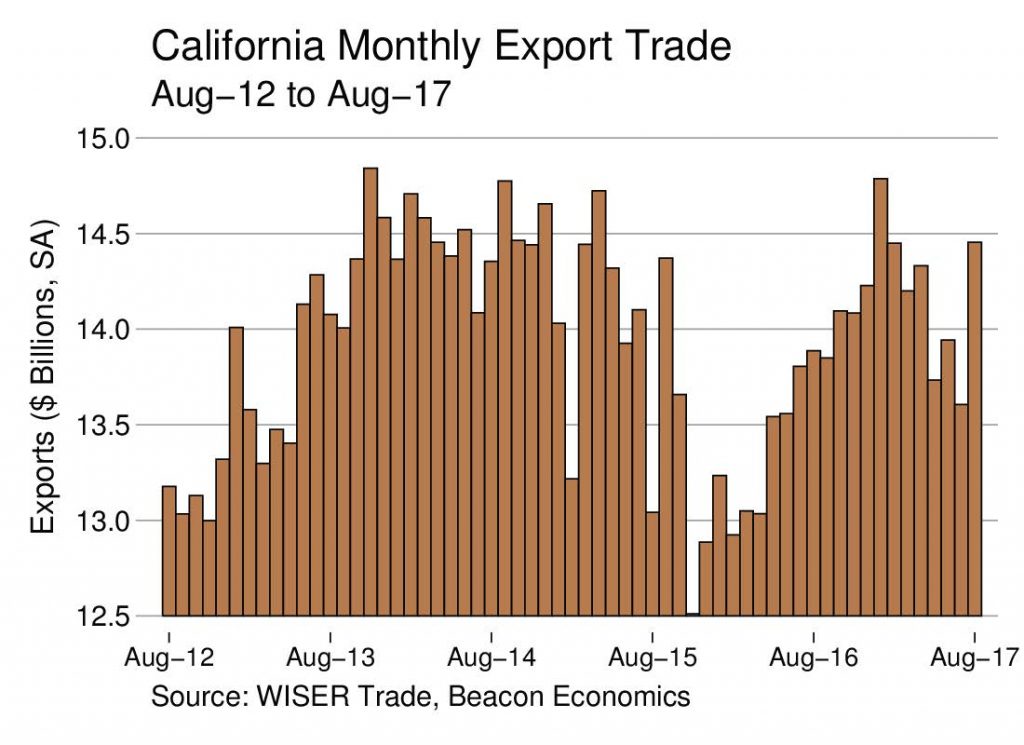
California’s exporters recorded modest growth in August, according to a recent Beacon Economics analysis of U.S. trade statistics released October 5 by the U.S. Census Bureau.
Foreign shipments by California businesses totaled $14.69 billion for the month, a nominal 4.0% increase over the $14.12 billion recorded in August 2016.
The state’s exports of manufactured goods in August rose 7.2% to $9.55 billion from $8.91 billion one year earlier. Exports of nonmanufactured goods (chiefly agricultural products and raw materials) jumped by 7.9% to $1.64 billion from $1.52 billion. Re-exports, meanwhile, slipped by 5.1% to $3.50 billion from $3.69 billion.
California accounted for 11.4% of the nation’s overall merchandise export trade in August. Through the first seven months of 2017, the state’s exports are running 5.3% ahead of last year.
The ‘Weaker Dollar’ Misconception
Numerous media reports since spring have been describing the dollar as “weak” because its value against other currencies had been in almost steady decline throughout most of this year. That makes it difficult to understand why California’s exports have either fallen (as they did in July) or not been more robust, as standard economic theory would expect.
The Wall Street Journal Dollar Index measures the dollar against a basket of 16 foreign currencies. On January 3, 2017, the index stood at 93.56. By August 31, it had fallen to 85.65. That’s a drop of roughly 8.0%. (It was back up to 86.82 on October 5.)
But weak relative to when? Like most assessments of international trade, our foreign trade reports compare the most recent month or months of statistics against the same period one year earlier. So media reports attributing a sluggish export trade to a “weak dollar” are wrong in implying that the dollar was stronger a year ago.
The dollar’s peak at the start of this year came after an intense two-month rally which saw the dollar go from 88.01 on November 8 (Election Day) to a high of 93.56 at the start of 2017, a post-election bump of 6.3%. Between then and late summer, the dollar had been a downhill slope. But that rise and fall is irrelevant to year-over-year comparisons of trade flows this summer. The real question is what was the dollar’s level during the comparison month or months one year earlier. Looking back at June–August 2016, what we find is that last summer’s dollar was pegged at roughly the same value as this summer’s dollar.
Pundits who are claiming that exports are disappointing due to a weak dollar are getting the timing all wrong. It simply cannot be argued that exports were lower than hoped for in August 2017 than they were in August 2016 because of a weaker dollar if, in fact, that dollar index was the same now as it was then.
California Imports Rise
The U.S. Department of Commerce has determined that California was the state-of-destination for 18.5% of all U.S. merchandise imports in August, with a value of $38.0 billion, 4.6% higher than the $36.34 billion in imported goods in August 2016. Manufactured imports totaled $34.41 billion, up 3.5% from $33.25 billion last year. Non-manufactured imports in August were valued at $3.60 billion, fully 16.5% higher than the $3.09 billion recorded one year earlier.
A Closer Look At The Numbers
As always, Beacon Economics cautions against reading too much into month-to-month fluctuations in state export statistics, especially when focusing on specific commodities or destinations. Significant variations can occur as the result of unusual developments or exceptional one-off trades and may not be indicative of underlying trends. For that reason, Beacon Economics compares the latest three months for which data are available (i.e., June–August) with the corresponding period one year earlier.

Leading Export Commodities
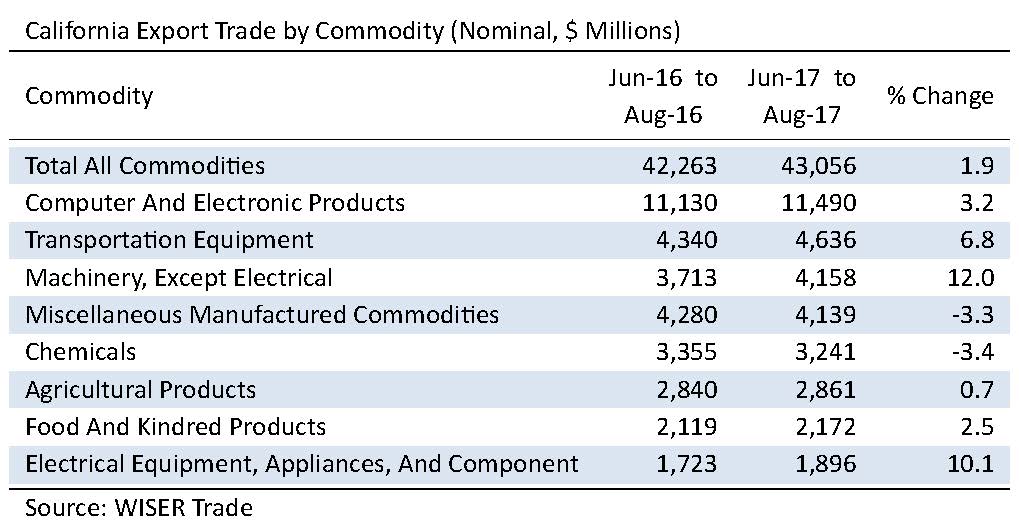
California’s merchandise exports during the year’s second quarter totaled $43.06 billion, a nominal gain of 1.9% from the $42.26 billion in the same months last year. Of the state’s 10 leading categories of exports, seven saw increases.
On the plus side, the list was topped by shipments of Computer & Electronic Products (computers and peripherals; communication, audio and video equipment; navigational controls; and electro-medical instruments), which rose 3.2 % to $11.49 billion from $11.13 billion.
The state’s exports of Transportation Equipment (automobiles, trucks, trains, boats, airplanes, and their parts) fared even better, increasing by 6.8% to $4.64 billion from $4.34 billion. Exports of Non-Electrical Machinery (machinery for industrial, agricultural and construction uses as well as ventilation, heating, and air conditioning equipment) roared ahead by 12.0% to $4.16 billion from $3.71 billion.
Agricultural exports edged up 0.7% to $2.86 billion from $2.84 billion, while shipments abroad of Food & Kindred goods rose 2.5% to $2.17 billion from $2.12 billion.
Exports of Electrical Equipment and Appliances leapt up 10.1% to $1.90 billion from $1.72 billion. Exports of Fabricated Metal Products rose 7.3% to $1.09 billion from $1.01 billion.
On the downside, shipments of Miscellaneous Manufactured Commodities (a catchall category of merchandise ranging from medical equipment to sporting goods) slipped 3.3% to $4.14 billion from $4.28 billion. Chemical exports (including pesticides and fertilizers; pharmaceutical products; paints and adhesives; soap and cleaning products; and raw plastics, resins, and rubber) also declined by 3.4% to $3.24 billion from $3.56 billion. Exports of Primary Metal Manufacturing products tumbled by 53.2%, falling to $805 million from $1.72 billion.

Destinations
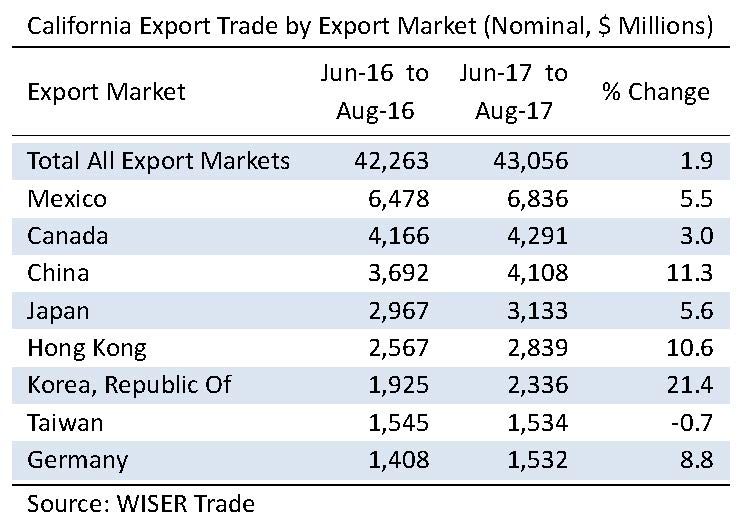
Mexico maintained its status as California’s most important export destination during the last three months. Shipments south of the border grew by 5.5% to $6.84 billion from $6.48 billion. Canada retained its traditional status as California’s second largest export market during the latest three-month period with shipments valued at $4.29 billion, a 3.0% bump over the $4.17 billion during the same period last year. Exports to China jumped 11.3% to $4.11 billion from $3.69 billion. In fourth place was Japan, which saw its import trade from California expand by 5.6% to $3.13 billion from $2.97 billion. Hong Kong (up 10.6% to $2.84 billion from $2.57 billion) came in fifth.
The state’s export trade with the economies of East Asia expanded by 3.2% to $15.73 billion from $15.25 billion. By comparison, California’s exports to the European Union edged up 2.2% to $7.81 billion from $7.65 billion.
Mexico and Canada, America’s partners in the North American Free Trade Agreement, accounted for 25.8% of California’s merchandise export trade in the latest three-month period, up from 25.2% one year ago.
Mode of Transport
During the most recent three months, 50.5% of the state’s $43.06 billion merchandise export trade went by air, while waterborne transport carried 26.5 % of the outbound trade. The balance of exports travelled overland to Canada and Mexico.

Outlook
Beacon Economics concludes that the near-term outlook for California exporters remains highly positive, if only economic fundamentals are considered. The analysis warns, however: “It is on the policy front that conditions may deteriorate during the remainder of the year.”
Beacon Economics finds it “encouraging” that, as the Organization for Economic Cooperation and Development (OECD) recently reported, all 45 of the major world economies the OECD regularly monitors are growing, with the majority growing faster this year than they were last year. The World Bank also has upgraded its forecast for growth in the volume of world merchandise trade from 2.4% to 3.6%.
“On the other hand, the President continues to use social media to question the basic premises of free trade, often in marked contrast to statements made by members of his administration,” Beacon’s experts comment. “The President remains focused on trade deficits, as though this is the only metric by which the efficacy of trade relations are evaluated. As a result, he has continued to question the foreign trade agreement between the United States and South Korea at a time when the security relationship between the two countries could not be of more vital importance.
“The Trump administration further appears to be laying the groundwork for trade policy confrontations with a host of America’s largest trading partners, most prominently China, Japan, South Korea, Germany, Canada, and Mexico — countries which account for half of California’s merchandise export trade.” Worse, in Beacon’s experts’ view, is that “the President appears willing to undermine the World Trade Organization and the order that exists in the structures by which nations trade.”
Staff Contact: Susanne T. Stirling


