Trading Partner Portal: Russia

Economic Impact of Russia’s Invasion into Ukraine
CalChamber, February 25, 2022
Trade Overview
After the December 1991 dissolution of the Soviet Union, the Russian Federation became its successor state, inheriting its prominent place on the world stage. Russia boasted a population of 143.51 million and a GDP of $2.56 trillion in 2025. Trade with Russia around the world, and specifically with the U.S. has changed dramatically due to sanctions.
U.S. – Russia Trade
Two-way goods trade between Russia and the U.S. totaled $4.38 billion a significant decrease from the $36.03 billion in 2021. The U.S. exported $593 million in 2025 to Russia, with top exports being chemicals ($235 million), computers and electronic products ($118 million), miscellaneous manufactures ($71 million), processed foods ($48 million), and apparel & accessories ($35 million).
Imports from Russia totaled $3.79 billion in 2025, as compared to $29.64 billion in 2021. Of the 2025 total, $2.71 billion was made up of chemicals, followed by primary metals manufactures ($758 million), transportation equipment ($127 million), wood products ($76 million), and agricultural products ($42 million).
All services trade between the United States and Russia in 2025 totaled $1.53 billion, with exports equaling $ 1.94 billion. Top exported services to Russia were travel, charges for intellectual property use, telecommunications, computer, & information services, other business services, and government goods and services not included elsewhere.
Service imports from Russia to the U.S. totaled $340 million, with top imports being travel, other business services, transport services, telecommunications, computer, & information services, and financial services.
California – Russia Trade
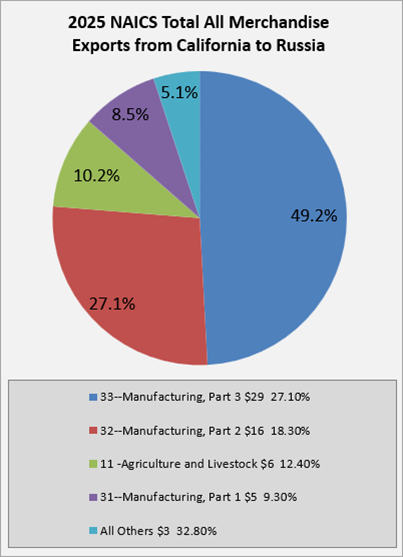
California exported $56 million in goods to Russia in 2025, $16 million was attributed to computer and electronic products. This was followed by miscellaneous manufactured commodities ($15 million), computer and electronic products ($13 million), products supporting agriculture and forestry ($5 million), and processed foods ($2 million).
In the same year, California imported $73 million from Russia, a significant decrease from $2.13 billion in 2021.
Chemicals were the largest segment of these imports, coming in at $52 million. Other top imports included wood products ($7 million), primary metal manufactures ($3 million), processed foods ($3 million), and computer and electronic products ($1 million). (US Department of Commerce)
Foreign Direct Investment
In 2025 total foreign direct investment by Russia into the U.S. reached $3.9 billion, while total U.S. direct investment into Russia being $7.8 billion according to SelectUSA. The top industry sectors for Russian FDI are software and IT services, real estate, business services, plastics, chemicals, and transportation. (Select USA)