Trading Partner Portal: South Africa

South African Business 2025 Edition
Global Africa Network, South African Business
Trade Overview
Over the past three decades, South Africa’s post-apartheid government has made progress. South Africa is the second or third largest economy in Africa, in competition with Egypt. Their GDP totaled $427.18 billion in 2025. Their peaceful transition to democracy, priorities given to economic growth and dedication to human rights allowed South Africa to host the 2010 FIFA World Cup, which solidified their place on the world stage. Current population is 64.75 million people with an annual growth of roughly 1.1%.
(U.S. Department of State and World Trade Organization)
U.S. – South Africa Trade
In 2025, two-way trade between South Africa and the United States was approximately $22.75 billion. The United States exported $6.29 billion to South Africa, of which $1.31 billion was made up of transportation equipment. This was followed by non-electrical machinery ($863 million), oil and gas ($795 million), chemicals ($788 million), and computer and electronic products ($730 million).
In 2025, the United States imported $16.45 billion from South Africa, $12.70 billion of that being primary metals. Other top imports included transportation equipment ($920 million), miscellaneous manufactures ($702 million), chemicals ($495 million), and agricultural products ($239 million).
Services trade between the United States and South Africa totaled roughly $6.02 billion in 2025, with exports totaling $3.97 billion. Top exports were travel, financial services, charges for intellectual property use, telecommunications, computer & information services, and other business services.
Imported services from South Africa to the U.S. totaled $2.04 billion. Top imports were travel, other business services, financial services. personal, cultural & recreational services, and transport services.
California – South Africa Trade
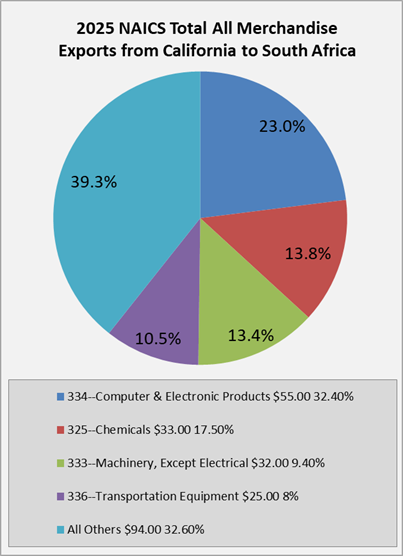
California exported over $238 million to South Africa in 2025, with computers and electronic equipment accounting for $54 million of this total. This was followed by chemicals ($33 million), non-electrical machinery ($32 million), transportation equipment ($25 million), and agricultural products ($21 million). U.S. Department of Commerce
This same year, California imported $659 million in imports from South Africa, with primary metals manufactures being the top category at $292 million. This was followed by transportation equipment ($155 million), miscellaneous manufactures ($49 million), computer and electronic products ($40 million), and agricultural products ($29 million).
FDI – South Africa
According to the most recent figures, South Africa invested $4.3 billion into the United States economy. In 2025, the United States invested $7.9 billion into South Africa, an over 8.5% increase from 2024.
South African FDI in the U.S. contributed to 6,700 jobs, contributed $27 million in research and development, and contributed $508 million to expanding U.S. exports. The top industry sectors for South African FDI were software and IT services, financial services, business services, paper & packaging, transportation, and auto components. Bureau of Economic Analysis, Select USA
CalChamber Resources
Business
- U.S. Commercial Service South Africa
- U.S.-Africa Chambers of Commerce Network
- South Africa Department of Trade and Industry
- Cape Regional Chamber of Commerce and Industry
- Global Africa Network
- Trade Invest Africa