Trading Partner Portal: Hong Kong

Trade Overview
Total population for Hong Kong was 7.5 million in 2025 with GDP equaling $427.31 billion.
The United States has substantial economic ties with Hong Kong. In August 2020, the U.S. State Department reported that there are some 1,300 U.S. firms and approximately 85,000 U.S. residents in Hong Kong. The latest available figures on U.S. direct investment in Hong Kong show investment at about $86.8 billion, making the United States one of Hong Kong’s largest investors.
U.S. – Hong Kong Trade
In 2025, two-way goods trade between Hong Kong and the United States was $38.80 billion, with U.S. exports to Hong Kong totaling $33.67 billion. Top exports were computer and electronic products ($11.01 billion), primary metals manufactures ($6.81 billion), miscellaneous manufactures ($6.43 billion), transportation equipment ($1.81 billion), and chemicals ($1.34 billion).
Imports from Hong Kong to the U.S. totaled $5.13 billion in 2025. Top imports were primary metals manufactures ($2.11 billion), goods returned ($2.00 billion), miscellaneous manufactures ($361 million), computer and electronic products ($267 million), and processed foods ($69 million).
Total services trade between Hong Kong and the U.S. was $33.23 billion, with exports totaling $17.27 billion. top services exported were charges for intellectual property use, other business services, financial services, transport services, and insurance services.
Imported services from Hong Kong to the U.S. totaled $15.95 billion. Top services included transport, other business services, financial services, travel, and telecommunications, computer, & information technology.
California – Hong Kong Trade
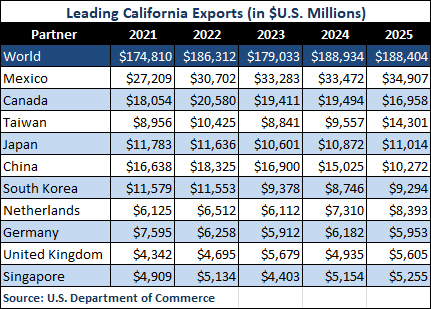
Hong Kong was the 12th largest export destination for California in 2025 which exported approximately $4.71 billion in goods to Hong Kong. The top exports to Hong Kong were computer and electronic products ($2.28 billion), miscellaneous manufactures ($556 million), processed foods ($414 million), agricultural products ($317 million), and chemicals ($237 million).
Imports in this same year totaled $354 million. Top imports included reimports ($171 million), miscellaneous manufactures ($73 million), processed foods ($30million), computer & electronic products ($24 million), and chemicals ($10 million).
There are 98,000 Hong Kongers that call California home, which make up 51% of all Hong Kong immigrants within the U.S. There are 1,000 students from Hong Kong studying in California universities each year. In 2017, 62,000 Hong Kongers traveled to California as a tourist destination, which accounted for 42% of all Hong Kong tourists to the U.S. Per capita, Hong Kong is the largest importer of California goods. Hong Kong is the third largest importer of U.S. wine exports internationally and the largest Asian importer of wine. (LAEDC and HKTDC)
FDI – Hong Kong
In 2025, total FDI stock in the U.S. from Hong Kong totaled $21.8 billion, while U.S. FDI into Hong Kong totaled $103.7 billion. Hong Kong FDI in the U.S. supported 35,500 jobs, invested $18.2 billion in research and development, and another $1.7 billion in expanding U.S. exports. The top industry sectors for Hong Kong FDI in the U.S. were: industrial equipment, software and IT services, communications, business services, food and beverages, and financial services. Select USA
More Resources:
U.S. Department of Commerce
US Census Bureau Trade in Goods – Hong Kong
U.S. – Hong Kong Wine Agreement
California vintners thirsty for a taste of China’s booming wine market
Los Angeles Times, May 25, 2010
CalChamber Resources
Business
- California Governor’s Office of Business and Economic Development (GO-Biz)
- U.S. Commercial Service Hong Kong
- AmCham Hong Kong
- Asia Pacific Economic Cooperation (APEC)
- HKTDC Belt and Road
- Hong Kong Economic & Trade Offices
- Hong Kong Trade Development Council