

Trade Statistics
California is one of the 10 largest economies in the world with a gross state product of over $4 trillion. International trade and investment are major parts of our economic engine that broadly benefit businesses, communities, consumers and state government. California’s economy is diverse, and the state’s prosperity is tied to exports and imports of both goods and services by California-based companies, to exports and imports through California’s transportation gateways, and to movement of human and capital resources.
California’s nominal GDP reached $4.25 trillion, and places California behind only the United States, China, Germany and Japan in global rankings. California is currently the 5th largest economy in the world.
Although trade is a nationally determined policy issue, its impact on California is immense. In 2025, California exported to over 225 foreign markets. Trade offers the opportunity to expand the role of California’s exports. In its broadest terms, trade can literally feed the world and raise the living standards of those around us.
According to the United Nations, global trade continued to grow through the second half of 2025, although slowed, with global trade projected to exceed $35 trillion for the first time. This was an increased projection of about 7 percent or $2.2 trillion from 2024. Trade in goods claims about $1.5 trillion of this rise.
Global goods trade continues to see a variety of changes, as value chains continue to reconfigure and geopolitics change trade and investment maps.
As well, exports of services continue to grow faster than goods, with digitally deliverable services being a fast-growing segment of global trade. Services exports now account for 27% of global trade and grew by close to 9 percent in 2025.
In 2026, global trade sees continuing pressure from slower growth, geopolitical fragmentation, accelerating digital and green transactions and tight regulations nationally. These forces are noted as reshaping trade and investment flows. Despite this trade has remained steady.
|
2025 Trade Statistics are available |
| U.S. International Trade in Goods and Services, December and Annual 2025 Bureau of Economic Analysis, February 19, 2026 |
International Activities
Global Trade Facts
The world population as of February 2025, is 8.17 billion people. As of February 23, 2026, one birth is expected every 9 seconds, and one death every 9 seconds worldwide. (U.S. Census Bureau)
In 2024, the World Trade Organization saw merchandise trade grow by 2.9 percent after growing by 1.2 percent the year prior, before a very different trade landscape in 2025, which brought on large changes to trade across the world. the beginning of 2025 looked very different, starting with many new tariff announcements from the United States, this downgraded expectations for merchandise trade volume growth by nearly 3 percentage points, according to WTO economists. Even with a slight contraction 0.2%, the WTO still expected trade to stay resilient.
Causes of concern came from the disruptions in normal trade routes and potential fragmentation in world trade. Regional conflicts and geopolitical tensions continued to be one of the largest disruptions from 2024 to 2025. These were seen as detrimental to global economic growth, highlighting that low-income economies would suffer the worst. However, it should be noted that one ‘silver lining’ had been the reminder to many governments, business, and households, that predictable trading conditions were so valuable.
Also noted has been the rise of AI, with the WTO noting that AI could raise goods and services trade by close to 40% by 2040. AI is boosting productivity across sectors, which underpins economic growth. WTO simulations suggest that AI could lead to significant increases in global trade and real income. (WTO)
The International Monetary Fund projects the world economy to grow at 3.3% for 2026 and 3.2% for 2027, revised since the 2025 World Economic Outlook. This is as ‘ technology investment, fiscal and monetary support, accommodative financial conditions, and private sector adaptability offset trade policy shifts.”
Global inflation is set to decline by a 3.8% in 2026 and 3.4% in 2026 based on current estimates. U.S. inflation will have a gradual return to target, key risks to this being the reevaluation of technology (AI) and continued escalation of geopolitical tensions.
World Trade Statistical Review
World Economic Outlook Update (January 2026)
U.S. Trade Facts
In 2025, combined goods and services exports totaled $3.43 trillion, with goods totaling almost $2.2 trillion and services totaling $1.23 trillion individually.
Services saw a surplus of $339.5 billion, an increase of $27.6 billion, while the goods deficit grew 2.1% or $25.5 billion. There was an increase of $117.7 billion in goods exports in 2025.
In 2025, combined goods and services imports totaled $4.33 trillion. Individually, goods imports totaled $3.44 trillion, an increase of $143.2 billion, and imports of services totaled $895.4 billion, an increase of $54.5 billion.
The goods and services deficit narrowed to $901.5 billion, down $2.1 billion from 2024. The 2025 figures show surpluses in billions of dollars with the Netherlands, South and Central America, United Kingdom, Hong Kong, and Brazil leading by $60.7 billion, $52.4 billion, $32.2 billion, $28.5 billion, $14.4 billion respectively (Bureau of Economic Analysis)
The United States is the world’s largest economy with a projected GDP of $ 31.1 trillion in 2025, according to the Bureau of Economic Analysis. The population of the U.S. is approximately 342.4 million.
The U.S. Commercial Service, a branch of the U.S. International Trade Administration, reported more than $100 billion in U.S. export revenue through their services as of 2025, with more than 100 facilities in over 80 countries worldwide to help with exporting needs for small to medium-sized businesses. With around 92,800 clients, they helped to support over 482,900 U.S. jobs.
The largest export markets for U.S. goods in 2025 were Mexico ($337.96 billion), Canada ($329.80 billion), China ($106.31 billion), the United Kingdom ($97.01 billion), and the Netherlands ($95.64 billion).
Until just a few years ago, China was easily the largest U.S. trading partner, where individual countries were concerned. But it’s fallen to third place behind Canada and Mexico, as the result of the increased trade friction that began in the first Trump administration and has continued in the second administration. This has continued to prompt companies to diversify their supply chains. The 27 nations of the European Union can also collectively stake a claim to being the largest U.S. trading partner, with exports totaling $414.43 billion.
Despite this, the U.S. still has a large trading deficit with China, with the goods deficit alone being roughly -$202.07 billion in 2025, a sharp decrease from the previous year of -$295.51 billion. Nationally the U.S. also has trading deficits with Mexico, the EU, Canada and Vietnam, some of its largest trading partners.
For more info on international trade in goods and service.
Source: Bureau of Economic Analysis
California Trade Facts
 The U.S. Department of Commerce reported that, in 2025, California goods exports amounted to $188.40 billion. This was an increase of roughly 2.4% from the previous year’s total of $183.93 billion.
Goods exports from California accounted for roughly 9.1% of total U.S. goods exports in 2025. California exports translate into jobs for around 582,000 Californians (from current data available), which can pay up to an estimated 18 percent above the national average according to the United States Trade Representative.
In 2025, exports to FTA markets accounted for 41.91% of California exports. California exports to FTA partners totaled $78.97 billion in 2025. (ITA)
As of 2024 (current data available), there were an estimated 18,963 foreign owned enterprises (FOEs) in California that accounted for 814,102 jobs , amounting to $89 billion in wages. Top sources of FDI by foreign-owned enterprises were the United Kingdom, Japan, France, Canada, Germany, and Switzerland. The top industry sectors for FOEs were natural resources, construction, manufacturing, wholesale trade, retail trade, and transportation/warehousing/utilities. (LAEDC)
Top Export Sectors
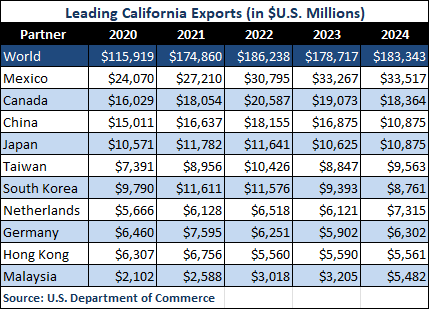
California is one of the top exporters in the nation of computers and electronic products, non-electrical machinery, transportation equipment, chemicals, and agricultural products. Computers and electronic products are California’s top exports coming in at $54.28 billion.
Mexico
Mexico continues to be California’s No. 1 goods export market. California goods exports to Mexico totaled $34.91 billion in 2025. Exports increased by 4.3% compared to 2024. Mexico purchases 18.5% of all California goods exports.
California’s exports to Mexico are driven by computers and electronic products, which account for 28.9% of all California exports to Mexico. Other top categories included transportation equipment, non-electrical machinery, and processed foods.
Canada
Canada is California’s second largest goods export market, purchasing just over 9% of all California exports. In 2025, California exported more than $16.96 billion to Canada, a drop from the previous years $19.49. Exports to Canada decreased by 12.98% in 2025 compared to 2024.
Computers and electronic products remained California’s largest exports, accounting for 22.14% of all California exports to Canada.
Asia
California is the second largest exporting state to Asia, after Texas. In 2025, California exported $72.26 billion in goods to the region.
Taiwan
Taiwan took the spot as the 3rd largest export market for California in 2025, with exports totaling $14.30 billion, an 49.6% increase from the previous year. Computer equipment was the top export at $8.023 billion, 56.10% of total exports.
Japan
California exports to Japan totaled $11.01 billion in 2025. Exports increased by 1.3% between 2025 and 2024. Computers and electronic products accounted for 17.3% of total exports.
Greater China
California exports to Mainland China totaled $10.72 billion in 2025, a 31.63% decrease from the year before. Computers and electronic products were the largest export to China accounting for 22.9% of exports.
Exports to Hong Kong were $4.71 billion in 2025, a decrease of 15.25% from the previous year. Hong Kong was California’s 12th largest export market.
European Union
California exports to the European Union (excluding the UK) totaled $31.38 billion in 2025. California is the second-top exporting state to Europe.
Computers and electronic products, chemicals, agricultural products, and miscellaneous manufactures, are California’s leading export sectors to the region. European Union countries purchase about 16.65% of all California exports.
California Export Totals
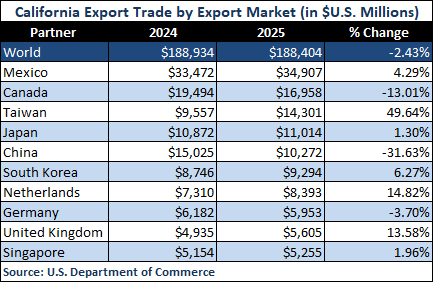
In 2025, California exported $188.40 billion to over 225 foreign economies. California’s top export markets are Mexico, Canada, Taiwan, Japan, and China.
California Import Totals
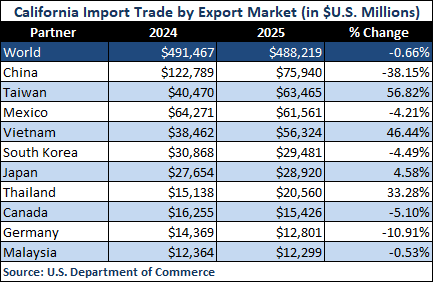
In 2025, California imported $488.219 billion worth of goods from the world. California’s top sources of imports are China, Taiwan, Mexico, Vietnam and South Korea.
Trade Deficits for California
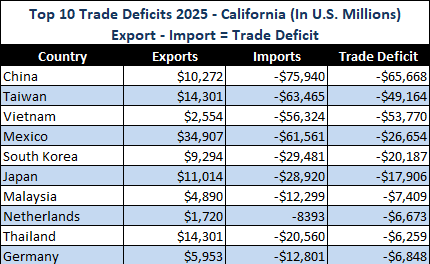 California experienced trade deficits in 2025, with trade with China having the largest deficit at -$65.67 billion. Other trade deficits with trading partners for California included Vietnam, Taiwan, Mexico, South Korea. Thailand, Japan, Malaysia, and Germany.
It should be noted that California has a goods trade surplus with Canada (+$1.53 billion) while the national goods trade balance with Canada is at a deficit of -$53.16 billion, according to data from the U.S. Department of Commerce.
USMCA Tracker Data Tool from the Brookings Institute
World Bank slashes growth outlook on trade concerns
The Hill, June 10, 2025
Global Economic Prospects
World Bank, June 2025
The Global Economy Enters a New Era
International Monetary Foundation, April 22, 2025
Freedom to Trade: The Moral Case Against Protectionism
Cato Institute, 2025
Additional Information
- California Agriculture Export Data – CDFA
- California Dept of Finance – California Trade Data
- California Dept of Finance – Economic Indicators
- California Travel & Tourism Commission – International Travel Reports
- California Tourism Facts and Figures –Visit California
- InvestAmerica
- Global Business Alliance (formerly OFII)
- Trade and American Competitiveness Coalition
- Trade Partnership Worldwide
- U.S. Bureau of Labor Statistics – California Economic Data
- U.S. Bureau of Transportation Statistics
- U.S. Census Bureau Foreign Trade Statistics
- U.S. Department of Agriculture – California Economic Data
- U.S. Department of Commerce – California Trade Stats
- U.S. Department of Commerce – TradeStatsExpress
- U.S. Department of Commerce – U.S. Census Bureau Trade in Goods and Services
- U.S. Department of Commerce – Trade and Economic Analysis
- U.S. Waterborne Import-Export Trade Data
- Wiser – Foreign Trade Database
- World Trade Organization – Country Trade Profiles