Trading Partner Portal: Uruguay

Trade Overview
Located in the southeastern coast of South America and bordered by Brazil and Argentina, Uruguay is the second smallest country on the continent. Despite this, it was ruled a high-income country by the World Bank in 2012, one of three in South America, and has a growing middle class and low poverty rates. It holds a constitution, with the president and Council of Ministers holding executive power. Brittanica, World Bank, U.S. Department of Commerce
With a low population density, and plenty of open space, Uruguay has potential for a large amount of economic growth. In 2025 its population totaled 3.8 million people and GDP totaled $85.35 billion, a significant rise from its drop due to the COVID-19 pandemic. Top sectors are agriculture, manufacturing, finance services, and natural resources and power.
It engages in trade with numerous countries across the globe, with Brazil being one of its top trading partners. China, Argentina and the United States are also major trading partners.
U.S. – Uruguay Trade
Two-way goods trade between the U.S. and Uruguay totaled $3.61 billion in 2025, with exports totaling $2.03 billion. Top exports to Uruguay were chemicals ($582 million), oil & gas ($507 million), computer and electronic products ($335 million), non-electrical machinery ($98 million), and transportation equipment ($79 million).
Imports that same year from Uruguay to the U.S. totaled $1.59 billion. Top import categories were processed foods 94987 million), paper ($204 million), wood products ($97 million), chemicals ($78 million), and goods returned ($51 million).
California – Uruguay Trade
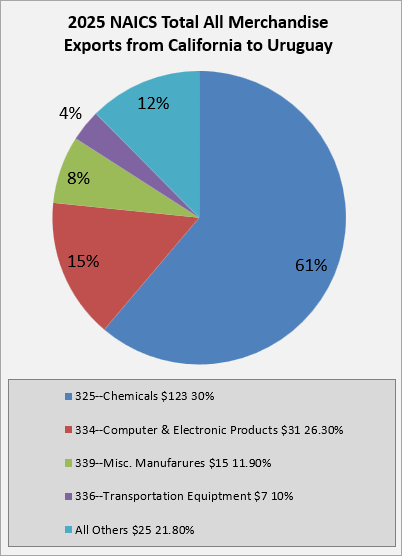
California is the third largest exporting state to Uruguay, with total goods exports in 2025 at $201 million, a steady increase since 2023. Top exports included chemicals ($123 million), computer and electronic products ($31 million), miscellaneous manufactures ($15 million), transportation equipment ($7 million), and processed foods ($4 million).
In 2025, total goods imports from Uruguay to California were $134 million. Top imports were processed foods ($110 million), miscellaneous manufactures ($13 million), fish and other marine products ($3 million), wood products ($2 million), and leather and allied products ($1 million).
FDI – Uruguay
FDI from Uruguay in the U.S. was $289 million in 2025, while U.S. FDI into Uruguay totaled $788 million.
CalChamber Resources
Business
- AmCham Uruguay
- Cuti: Uruguayan Chamber of Information Technology
- Business and Innovation Hub – Uruguay