Trading Partner Portal: Cambodia

Trade Overview
The Kingdom of Cambodia is a constitutional monarchy located in the mainland of Southeast Asia, with Vietnam to the east, Laos to the north, Thailand the west, and the South China sea to the south. It has a landscape fo plains and rivers, with mountains to the southwest and northern regions of the country.
In 2025, Cambodia’s population totaled 17.85 million people. GDP in that same year totaled $51.27 billion, with GDP growing at roughly 5.3%. GDP has continued to steadily grow since opening their economy again in 2021 after the COVID- 19 pandemic. Key industries in Cambodia’s economy are tourism, textiles, construction, rice milling, wood and wood products, and gem mining.
Cambodia is active in world trade, with multiple multilateral, bilateral, and free trade agreements with multiple countries. It has been a member of the WTO since 2004, and has membership with ASEAN, AFTA, and RCEP.
U.S. – Cambodia Trade
Two-way goods trade between Cambodia and the U.S. totaled $15.67 billion in 2025, with exports totaling $370 million. Top export categories were used or secondhand merchandise ($103 million), transportation equipment ($44 million), processed foods ($32 million), chemicals ($30 million), and beverages & tobacco products ($27 million).
Imports in this same year totaled $15.30 billion, with the top products from Cambodia to the U.S. being apparel and accessories at $4.96 billion. Other top exports included leather and allied products ($3.13 billion), electronic equipment, appliances, and components ($1.43 billion), plastics and rubber products ($1.40 million), and furniture & fixtures ($1.09 billion).
Cambodia – California Trade
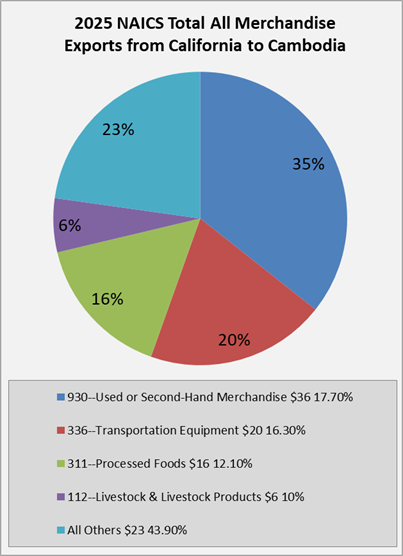
In 2025, exports from California to Cambodia totaled $101 million. Top exports from the Golden State included used or secondhand merchandise ($36 million), transportation equipment ($20 million), processed foods ($16 million), livestock & livestock products ($6 million), and chemicals ($5 million).
In this same year, California imported $4.45 billion in goods from Cambodia, with the top import being apparel and accessories and $1.61 billion. Other top imports included leather and allied products ($1.35 billion), plastics and rubber products ($347 million), electronic equipment, appliances, and components ($237 million), and furniture and fixtures ($209 million).
FDI – Cambodia
The inward foreign direct investment of the kingdom of Cambodia into the U.S. as of 2025 was $9.0 million. The U.S. outward flow of FDI into Cambodia was $139 million in this same year