Trading Partner Portal: Egypt

Trade Overview
Egypt spans the northeast corner of Africa and is considered a Mediterranean country. Egypt is considered a cradle of civilization, as it’s able to trace its history back longer than any other country. Islam is the official religion of Egypt and Arabic the official language, although there is a significant Christian minority in the country. The population of Egypt is 118.37 million, making it the most populous country in North Africa, the Middle East, and the Arab world, and the third most populous in Africa. The Sahara Desert makes up large regions of Egyptian land.
Egyptian GDP was $365.25 billion in 2025. Its economy is the second or third largest in Africa, in competition with South Africa, and one of the largest and most diversified in the Middle East. (Bureau of Economic Analysis).
U.S. – Egypt Trade
Two-way trade between the U.S. and Egypt totaled $12.28 billion, with exports from the U.S. to Egypt in 2025 totaled $9.42 billion. Top exports included oil & gas ($3.66 billion), agricultural products ($1.99 billion), chemicals ($1.14 billion), transportation equipment ($699 million), and minerals & ores ($394 million)
The U.S.’s imports from Egypt were $2.85 billion in 2025, with apparel and accessories totaling $1.31 billion. This was followed by processed foods ($479 million), chemicals ($224 million), primary metals manufactures ($197 million), and nonmetallic mineral products ($140 million). U.S. Department of Commerce
California – Egypt Trade
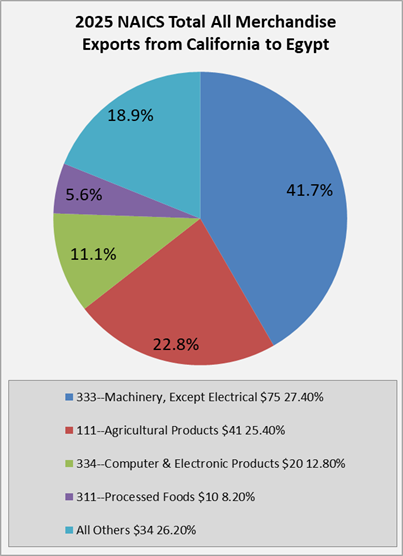
California exports to Egypt totaled $176 million in 2025, a 35% increase when compared to exports from 2024. Top exports included non-electrical machinery ($75 million), agricultural products ($38 million), computer & electronic products ($20 million), processed foods ($10 million), and transportation equipment ($7 million).
Imports from Egypt to California totaled $267 million in 2025, a 20 5 increase when compared to 2024 imports. Top imports were processed foods ($ 108 million), apparel and accessories ($105 million), textile mill products ($19 million), nonmetallic mineral products ($9 million), and electrical equipment, appliances 7 components ($9 million). U.S. Department of Commerce
CalChamber Resources
FDI – Egypt
In 2025, the U.S direct investment position in Egypt was $6.7 billion, an almost 13.7% increase from 2024.