Trading Partner Portal: India

Fact Sheet: The United States and India Announce Historic Trade Deal
The White House, February 9, 2026
Boom Time for India Promises Benefits for Relations/Trade with U.S., California
CalChamber, December 13, 2022
Interview Series Featuring California’s Key Trading Partners – Featuring Ambassador Dr. T.V. Nagendra Prasad, Consul General of India in San Francisco: Robust Relations, Cross-Border Startups Create Jobs, Trade Benefits Across Sectors
CalChamber, January 8, 2021
Trade Overview
Over the last decade, India’s developing economy has emerged to become an important player in the global market. With a workforce of over 500 million —over three times the workforce of the U.S.—India has the human capacity to sustain large and rapid development.
India’s population makes up just over 17% of the world’s population, and the country makes up 2.4% of the world’s surface area. Its GDP in 2025 totaled $3.96 trillion, and its population totaled over 1.46 billion people.
As of 2025, India is the world’s 6th largest economy and remains one of the fastest growing economies. As both a service-based and an agricultural economy, the country has seen strong growth in both sectors. The service industry has become an integral component of the Indian economy, making up 65% of the GDP while containing only 28% of the workforce.
Agriculture, on the other hand, is the most popular sector, representing 55% of the workforce, but only 17% of the GDP. This sector specifically is expected to grow by 4% every year for the next decade. India Brand Equity Foundation
U.S. – India Trade
India is the United States 10th largest trading partner. In 2025, the United States exported $45.61 billion to India in goods. Top exports included oil & gas ($9.99 billion), chemicals ($5.66 billion), computer and electronic products ($4.47 billion), transportation equipment ($3.60 billion), and miscellaneous manufactures ($3.02 billion). Two-way goods trade totaled $149.43 billion in the same year.
The U.S imported a total of 103.82 billion in goods in 2025, the largest category of these imports being computer and electronic products at $27.53 billion. Imports that followed were chemicals ($21.47 billion), miscellaneous manufactures ($7.26 billion), non-electrical machinery ($5.70 billion), and apparel and accessories ($5.22 billion).
U.S. total services trade in 2025 with India was $92.23 billion, with services exports totaling $43.56 billion. Top exported services were travel ($23.97 billion), other business services ($5.82 billion), charges for intellectual property use ($4.65 billion), financial services ($2.70 billion), and telecommunications, computer, and information services ($2.43 billion).
Services imports from India to the U.S. totaled $48.67 billion, with the top imports being other business services at ($20.72 billion), telecommunications, computer, and information services ($19.33 billion), travel ($4.04 billion), charges for intellectual property use ($2.17 billion), and financial services ($1.15 billion).
California – India Trade
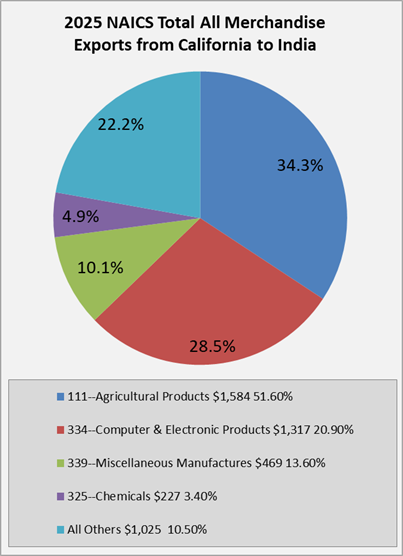
India is currently California’s 13th largest export market. In 2025, California exports to India brought in over $4.62 billion. California is a top exporting state to India. Top export categories included agricultural products ($1.58 billion), computer and electronic products ($1.32 billion), miscellaneous manufactures ($469 million), chemicals ($227 million), and waste and scrap ($183 million).
In this same year imports from India to California totaled $10.03 billion. Top imports from India included computer and electronic products ($4.17 billion), petroleum and coal products ($1.36 billion), textile mill products ($459 million), miscellaneous manufactures ($457 million), and apparel and accessories ($430 million).
U.S. Department of Commerce
Tourism
Some 579,000 travelers visited California from India in 2024 and spent an estimated $1.50 billion in the state (Visit California). California is also the leading destination state for Indian immigrants, home to 20% of the total nationwide. the largest Indian communities in California were found in the Bay Area (Bay Area Council).
FDI – India
According to the most recent figures in 2025, U.S. total stock foreign direct investment to India was $68.7 billion while Indian direct investment into the U.S. was $18.8 billion (Bureau of Economic Analysis).
Indian FDI supported 74,200 jobs and invested $345 million into research and development, with another $1.9 billion went to expanding U.S. exports. The top industry sectors for Indian FDI in the U.S. were: software and IT services, business services, pharmaceuticals, industrial equipment, metals, and communications. Select USA
In California, the nineteenth largest source of FDI through foreign-owned enterprises (FOEs) is India. Indian FOEs in California provided 10,876 jobs through 355 firms amounting to $1.57 billion in wages in 2025. The top jobs by sector are professional & business services, information, wholesale trade, manufacturing, and retail trade (World Trade Center Los Angeles FDI Report).
More Articles:
Seismic Shift – Economic Growth and Strategic Alignment Between the Bay Area and India
Bay Area Council, March 2023
Joint Statement from the United States – India Trade Policy Forum
U.S. Trade Representative, November 23, 2021
Trade Policy Review: India– World Trade Organization
CalChamber Resources
- American Chamber of Commerce in India
- Indian Consuls in California
- International Trade FAQs
- GO-Biz Stats: Indian FDI in CA
Business
- U.S. Commercial Service India
- Indo-American Chamber of Commerce, California
- Indus Foundation
- India-USA Trade Facilitation Portal